Yannick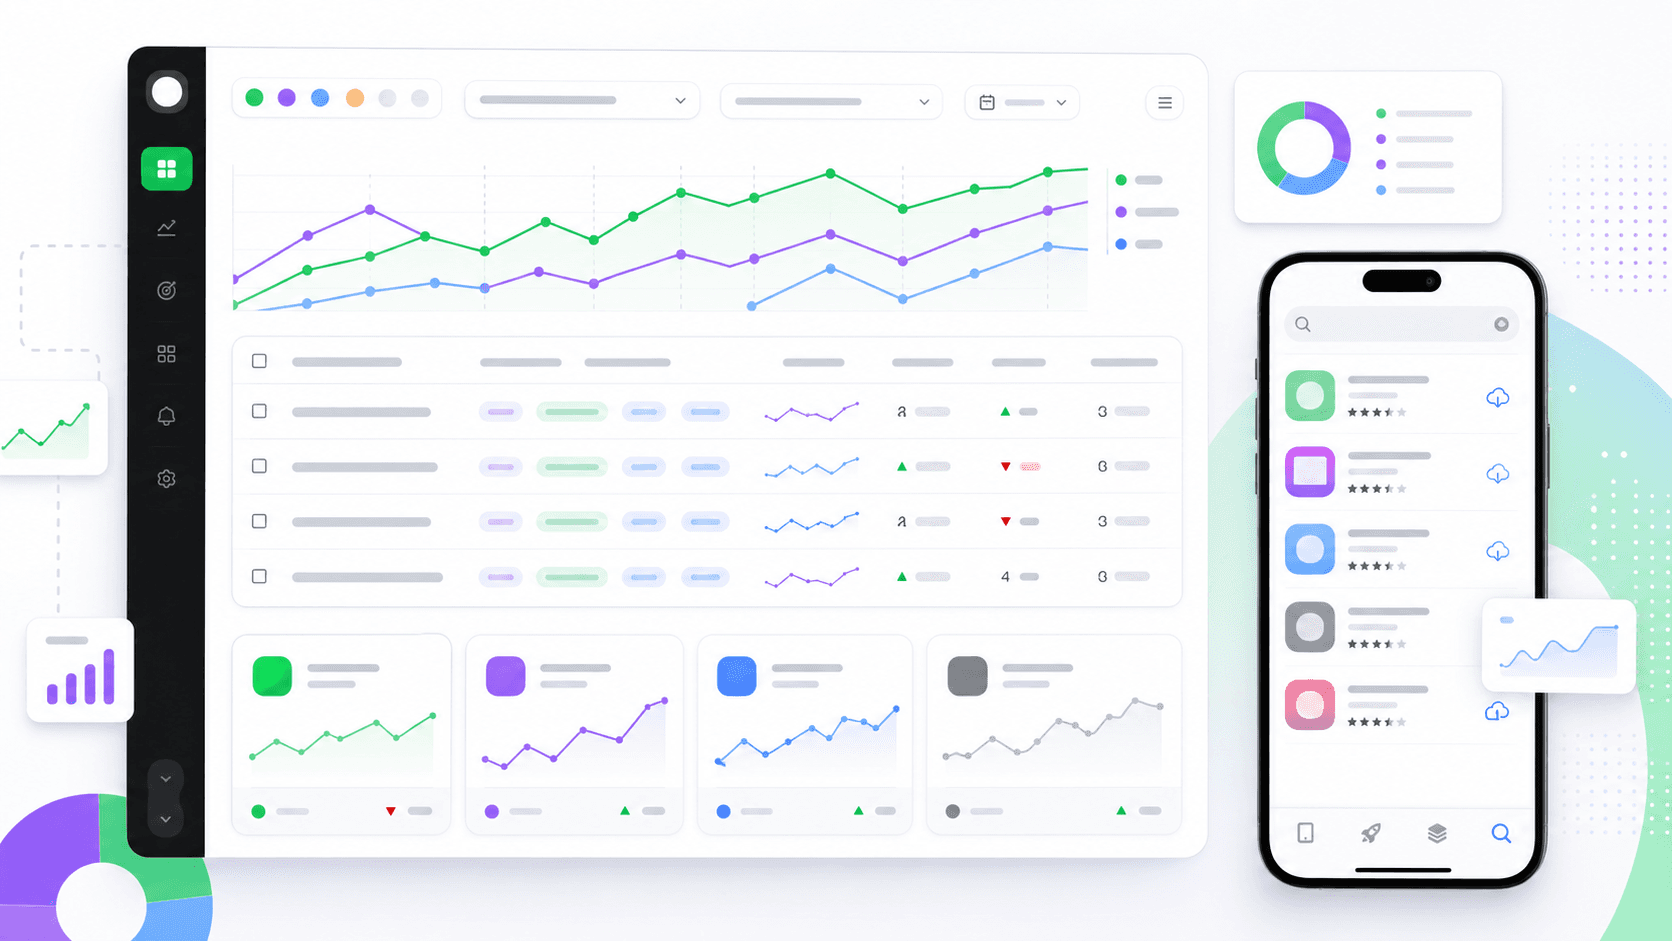
An ASO report should help a team decide what to do next. A dashboard of rankings and downloads is not enough: the report must connect store visibility, listing conversion, user quality, releases, and experiments, then separate evidence from interpretation. The structure below works as a monthly decision report with a lighter weekly operating view.
Reporting model
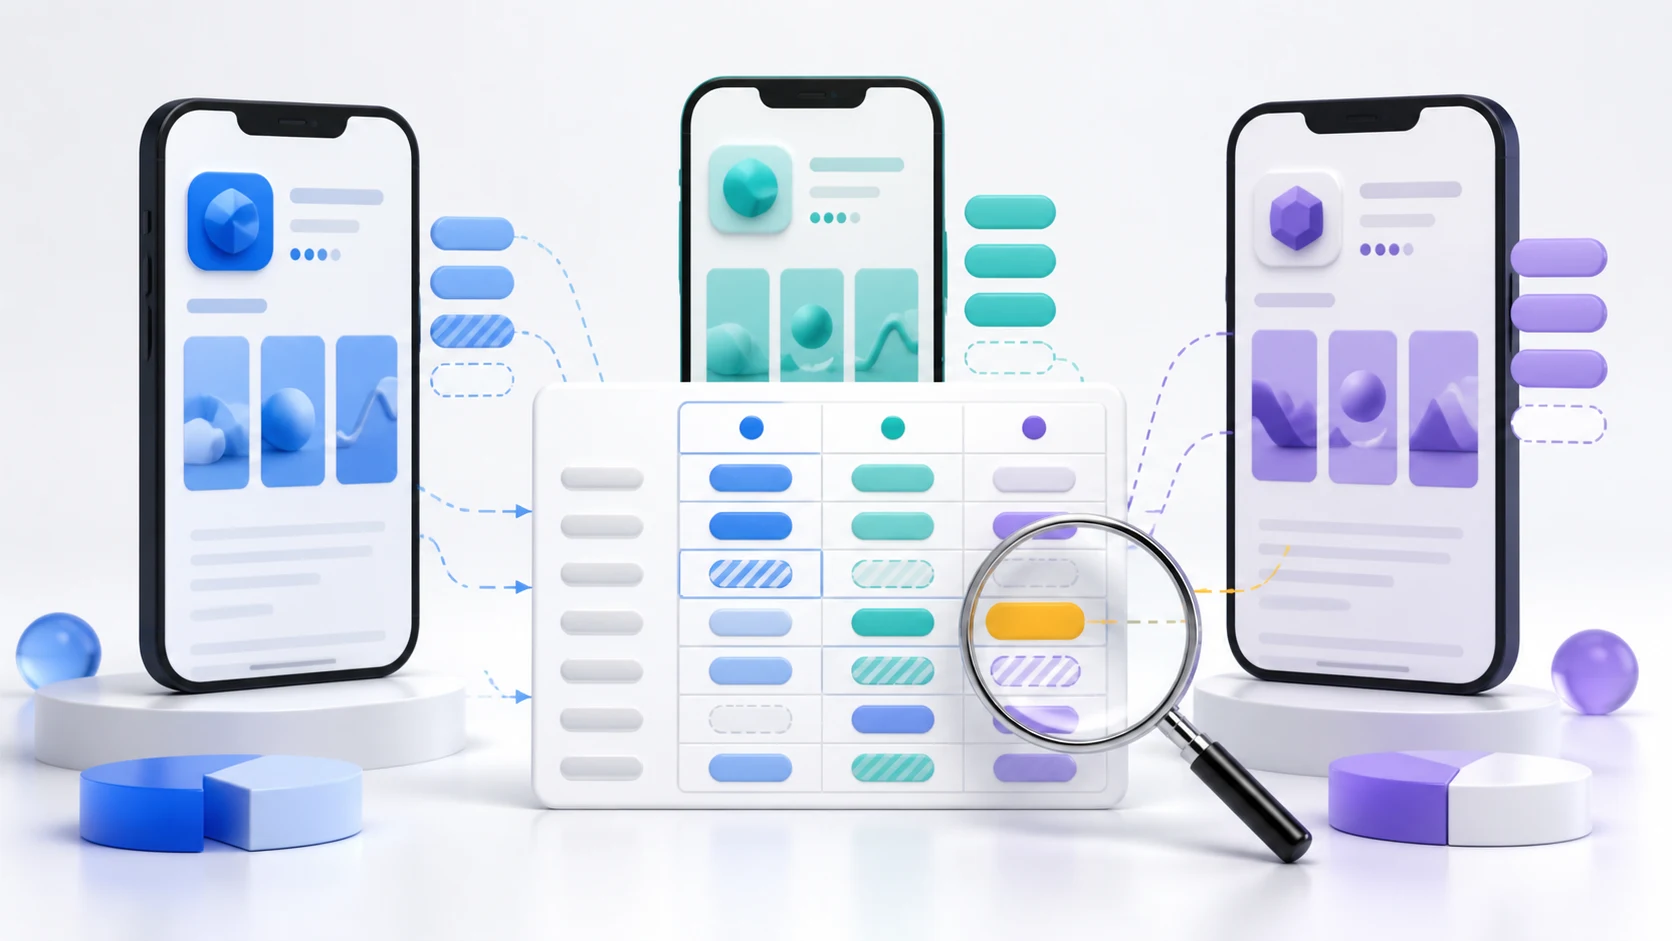
Report the funnel, explain the movement, assign the action
Visibility
Track search presence and audience mix, not isolated vanity rankings.
Conversion and quality
Connect store acquisition to ratings, retention, and product health.
Decisions
Every finding ends with an owner, deadline, expected effect, and guardrail.
Copyable ASO report outline
- Executive summary: three outcomes, three explanations, three decisions.
- Measurement scope: stores, countries, date range, comparison period, app versions, and data freshness.
- Acquisition funnel: impressions or visitors, product-page views, downloads or installers, and conversion.
- Search visibility: target keyword coverage, ranking distribution, winners, losers, and competitor movement.
- Creative performance: screenshot, icon, video, and custom-page experiments.
- User quality: retention proxy, uninstalls, ratings, reviews, crashes, and revenue where relevant.
- Market segments: country, language, device, channel, and listing/page.
- Change log: releases, metadata, creative, paid activity, featuring, pricing, and outages.
- Action plan: prioritized tasks with owners and success criteria.
1. Start with a decision-oriented executive summary
Use plain language and lead with the result. “US product-page conversion increased from 24% to 28% after treatment B reached sufficient traffic” is useful. “Conversion improved” is not. Every statement should include the segment and time period, plus the comparison baseline when relevant.
Separate confirmed evidence from hypotheses. A ranking gain after a metadata release is correlation until the timing, competitor movement, featuring, paid campaigns, and seasonality have been checked. Mark uncertain explanations explicitly and identify what additional evidence would confirm them.
2. Define every metric before showing it
Apple and Google use different acquisition terminology and denominators. Apple defines conversion rate in App Store Connect as total downloads plus pre-orders divided by unique-device impressions. Google Play acquisition reporting includes store listing visitors, acquisitions, and visitor-to-installer conversion. Keep the native definitions visible rather than merging both into a single ambiguous “CVR.”
Official references: Apple's metric definitions and Google Play's acquisition reporting documentation.
3. Report the acquisition funnel
Apple view
Impressions → product page views → first-time downloads → proceeds or downstream product activation.
Google Play view
Store listing visitors → acquisitions → visitor-to-installer conversion → retained installers or business outcome.
Show current period, comparison period, absolute change, percentage change, and sample size. Segment before interpreting. A blended conversion rate can hide a strong organic-search gain and a weak paid-campaign cohort that arrived at the same time.
4. Build a useful visibility section
Do not list hundreds of keyword positions. Group tracked terms by strategic cluster: brand, category, problem, feature, competitor, and localized terminology. Show how many target terms rank in the top 3, top 10, and top 30; which queries generated meaningful movement; and which competitors displaced the app.
- Tracked keyword coverage by market and language.
- Median or distribution-based ranking, not only an average.
- New entrants and terms lost from meaningful positions.
- Search-result context: which apps, ads, and editorial results appear.
- Metadata release annotations on the ranking timeline.
The AppLaunchFlow Keyword Monitor keeps country and language context beside daily rankings so a position change can be investigated rather than merely reported.
5. Explain creative and experiment performance
For each screenshot, icon, video, product page, or store listing experiment, record the hypothesis, treatment, eligible audience, start and end dates, traffic allocation, primary metric, guardrails, and decision. Do not label the winning percentage alone; include the baseline, uncertainty, and whether the result held across important segments.
Apple Product Page Optimization exposes conversion, improvement, and confidence. Google Play Store Listing Experiments has its own reporting model. Preserve screenshots of the exact control and treatment in the report archive so future teams know what was actually tested.
6. Add quality and business guardrails
ASO can increase installs while attracting the wrong audience. Pair acquisition with indicators such as first-session completion, activation, trial start, subscription conversion, retained installers, uninstalls, ratings, review themes, crashes, and refunds. Use only the metrics relevant to the product and label data-source limitations.
Google Play's statistics documentation covers installs, uninstalls, ratings, revenue, crashes, and comparison options. App Store Connect Analytics provides acquisition, engagement, and monetization views. Neither replaces product analytics for user activation and retention.
7. Maintain a change log beside the metrics
Record the exact timestamp and affected markets for metadata releases, creative changes, app versions, pricing, featuring, paid campaigns, outages, and major competitor events. Without this log, teams repeatedly attribute movement to the most memorable change rather than the most plausible cause.
8. End with a prioritized action table
| Action | Evidence | Expected effect | Guardrail | Owner / date |
|---|---|---|---|---|
| Test outcome-led first screenshot | High views, weak search conversion | Higher organic CVR | No quality decline | Growth / Aug 15 |
| Localize DE keyword cluster | Relevant terms rank 20–40 | More top-10 coverage | Readable metadata | ASO / Aug 22 |
Reporting cadence
- Daily alerts: outages, crashes, review spikes, or severe ranking losses.
- Weekly operating view: experiments, anomalies, release checks, and assigned tasks.
- Monthly decision report: normalized funnel, visibility, quality, interpretation, and priorities.
- Quarterly review: market portfolio, localization investment, positioning, and roadmap inputs.
Quality checklist
- Every metric has a source and definition.
- Store, market, device, and period are labeled.
- Absolute values accompany percentages.
- Release and campaign changes are annotated.
- Evidence and hypothesis are visibly separated.
- Experiments include the actual control and treatment.
- Every recommendation has an owner, deadline, and success criterion.
Practical deep dive
Make the ASO report a decision document
A useful report connects releases to observed changes and clearly separates evidence, interpretation, and next action. It should preserve the market, traffic, device, and time grain needed to reproduce every comparison.
| Report block | Required context | Useful comparison | Decision |
|---|---|---|---|
| Discovery | Country, store, query set | Rank and impressions versus baseline | Keep or revise keyword theme |
| Conversion | Page, source, device, assets | Views to installs by cohort | Test message or proof |
| Quality | Build and acquired cohort | Activation, retention, rating | Scale or narrow promise |
| Release log | Date, owner, exact change | Pre and post with settling window | Support, reject, or repeat |
Write findings with uncertainty
State what changed, where, and by how much, then list plausible explanations and competing causes. Do not label an asset or keyword as causal when several variables, traffic sources, or product changes moved in the same window.
End every major section with an owner, hypothesis, primary metric, guardrail, release vehicle, and review date. Keep inconclusive results in the history so the team does not repeat a low-information test.
Frequently asked questions
What should an ASO report include?
Include discovery, conversion, product quality, release history, market and traffic context, findings, uncertainty, and owned next actions.
How often should ASO reporting run?
Use a cadence that matches traffic and release frequency, with additional reviews after meaningful metadata, creative, localization, or product changes.
How should ASO changes be attributed?
Record exact changes and cohorts, allow for store settling, control concurrent variables where possible, and present causality only when the design supports it.
Sources and next steps
Continue with ASO audit checklist, keyword tracking guide, and screenshot A/B testing.