Yannick
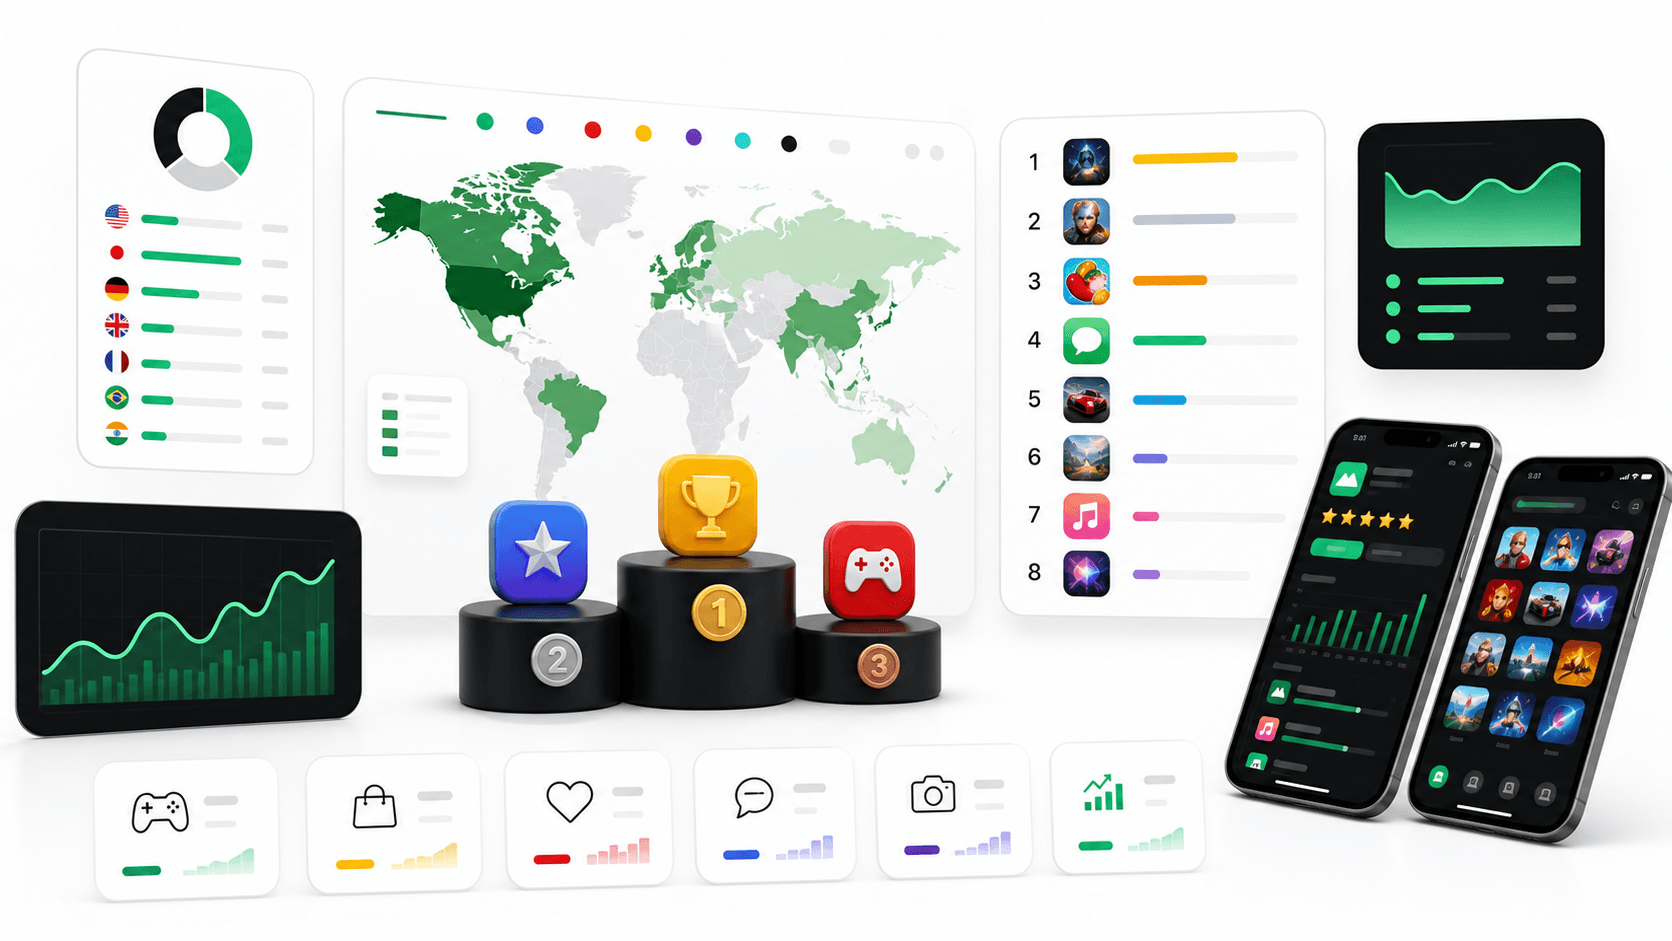
AppLaunchFlow Search Console data shows strong demand around top grossing apps, top grossing iOS apps, App Store top charts, and monthly trending app queries. That is a useful hint: founders, marketers, and indie developers are not only looking for a list. They are trying to understand what winning apps are doing differently.
Chart research
Separate the observation from the lesson
A chart position is a starting point. The useful work is comparing the promise, proof, monetization, and market context behind it.
Observe
Capture rank, date, country, category, offer, and first listing viewport.
Classify
Group repeated promises, proof styles, pricing signals, and localization choices.
Test
Turn one repeated pattern into a measurable listing hypothesis.
Fast workflow
- Open the current top grossing charts for your target country and category.
- Save 8-12 direct competitors and adjacent category winners.
- Compare their first screenshots, subtitles, price framing, and review language.
- Turn repeated patterns into one testable launch hypothesis.
- Update your screenshots or ASO copy, then monitor rankings and conversion.
What top grossing charts actually tell you
A top grossing app is not always the app with the most downloads. It is a signal that acquisition, activation, pricing, retention, and monetization are working together well enough to create revenue. For ASO research, that matters because the store listing is often where the first paid-user promise is made.
Use the chart as a pattern library. Look for the repeated promises: faster results, simpler habits, premium templates, privacy, creative control, or team productivity. Then compare whether your own first screenshot and short description make an equally concrete promise.
Chart rank does not explain causality. A brand may have large paid campaigns, strong retention, a mature subscription base, featuring, or offline recognition. Record what you can observe and label the rest as unknown. The purpose is to form better questions about your listing, not to claim that a color, caption, or paywall caused the revenue rank.
The ASO signals to capture from every chart winner
- First-screen promise: what benefit is visible before a user scrolls?
- Keyword language: does the app use category terms, outcome terms, or brand language?
- Visual proof: does the screenshot show the product UI, an end result, social proof, or a workflow?
- Monetization framing: does the listing imply premium access, saved time, professional output, or entertainment value?
- Localization depth: are screenshots, subtitles, and value props adapted per market?
| Capture | What it can show | What it cannot prove | Useful output |
|---|---|---|---|
| First screenshot | Primary promise and visual proof style | Which frame caused conversion | A first-frame message hypothesis |
| Subtitle or short description | Indexed language and visible positioning | Search volume or ranking weight | Terms to research and track |
| Price and trial framing | How value is communicated before install | Actual revenue mix or lifetime value | A clearer monetization message test |
| Localized listing | Whether the market receives adapted creative | The quality of the in-app localization | A localization QA and expansion brief |
Turn chart research into screenshot tests
The most useful output from chart research is not a mood board. It is a screenshot test. If five successful apps in your category lead with a before-after result, your next screenshot set should test a result-first first frame. If winners lead with workflow speed, test a caption that makes speed specific.
Weak takeaway
Competitors use bright gradients, so we should use brighter gradients.
Useful takeaway
The first image explains the paid outcome in under six words. Test a clearer first screenshot promise.
Write the hypothesis before opening the editor. For example: “New users searching for a shared budget app will understand the product faster if the first screenshot shows the household outcome instead of the transaction list.” Define the market, traffic source, asset change, and primary metric. Then use App Store screenshot A/B testing or a Google Play store listing experiment rather than replacing every frame at once.
A repeatable weekly chart review
- Pick one country, one category, and one chart type. Mixing everything together makes the insight mushy.
- Export or copy the top 20 apps and tag them by monetization model.
- Screenshot the first store-listing viewport for each app.
- Write down the first value prop in plain language.
- Choose one pattern to test in your own listing this week.
Repeat the capture on the same weekday and keep a dated archive. Charts move, store listings change, and seasonal offers expire. A dated comparison lets the team see which competitors changed their story before a rank move without pretending the sequence proves causation.
Start with the live Top Grossing Apps tool and pair it with the Keyword Monitor when you want to track whether a positioning change affects search visibility.
Common mistakes when copying top grossing apps
Do not blindly copy the visual style of a market leader. Big apps can win despite a messy listing because they already have brand demand. Smaller apps need sharper store messaging. Borrow the strategic pattern, not the surface treatment.
- Copying a brand-led screenshot when your app needs feature clarity.
- Using broad category language instead of a specific outcome.
- Ignoring country-specific chart differences.
- Changing every asset at once, then losing attribution.
Worked example: turn a chart pattern into a test
Suppose six high-grossing fitness apps lead with a personalized plan rather than a workout library. Your current first screenshot says “1,000 exercises.” Do not copy their colors or promise personalization you do not provide. Look for the truthful adjacent outcome: perhaps your app creates a weekly routine from available equipment.
Build one treatment around “Your weekly plan, built for your equipment,” show the setup and calendar in the next two frames, and hold the rest of the set stable. Compare product-page conversion and activation for the relevant market. The chart observation supplied the question; your product evidence and experiment supply the answer.
Top grossing app research FAQ
Are top grossing apps the most downloaded apps?
Not necessarily. Grossing charts reflect revenue performance, while download charts reflect acquisition volume. A high-grossing app may combine a smaller audience with strong subscriptions, purchases, retention, or payer conversion.
What should an indie developer copy from a chart leader?
Copy the research method and communication principle, not the brand identity. Study how the listing frames an outcome, proves it with UI, explains value, and adapts by market, then test a truthful version for your own product.
How often should I review top grossing charts?
A weekly snapshot is enough for an active competitor set, with a deeper monthly review of screenshots, metadata, offers, ratings, and localization. Always save the date, country, category, and chart type.